The Toolbox
What you really made.
What your sales brought in, less what those items cost you, less what it costs to run. These tools come with Pro.
Profit & Loss
Profit & Loss goes month by month:
- Revenue: what your recorded sales brought in.
- Cost of what sold: what those exact items cost you, at the average you paid.
- Expenses: everything on the Expenses page, with recurring ones counted every month they ran.
- Net profit: what's left.
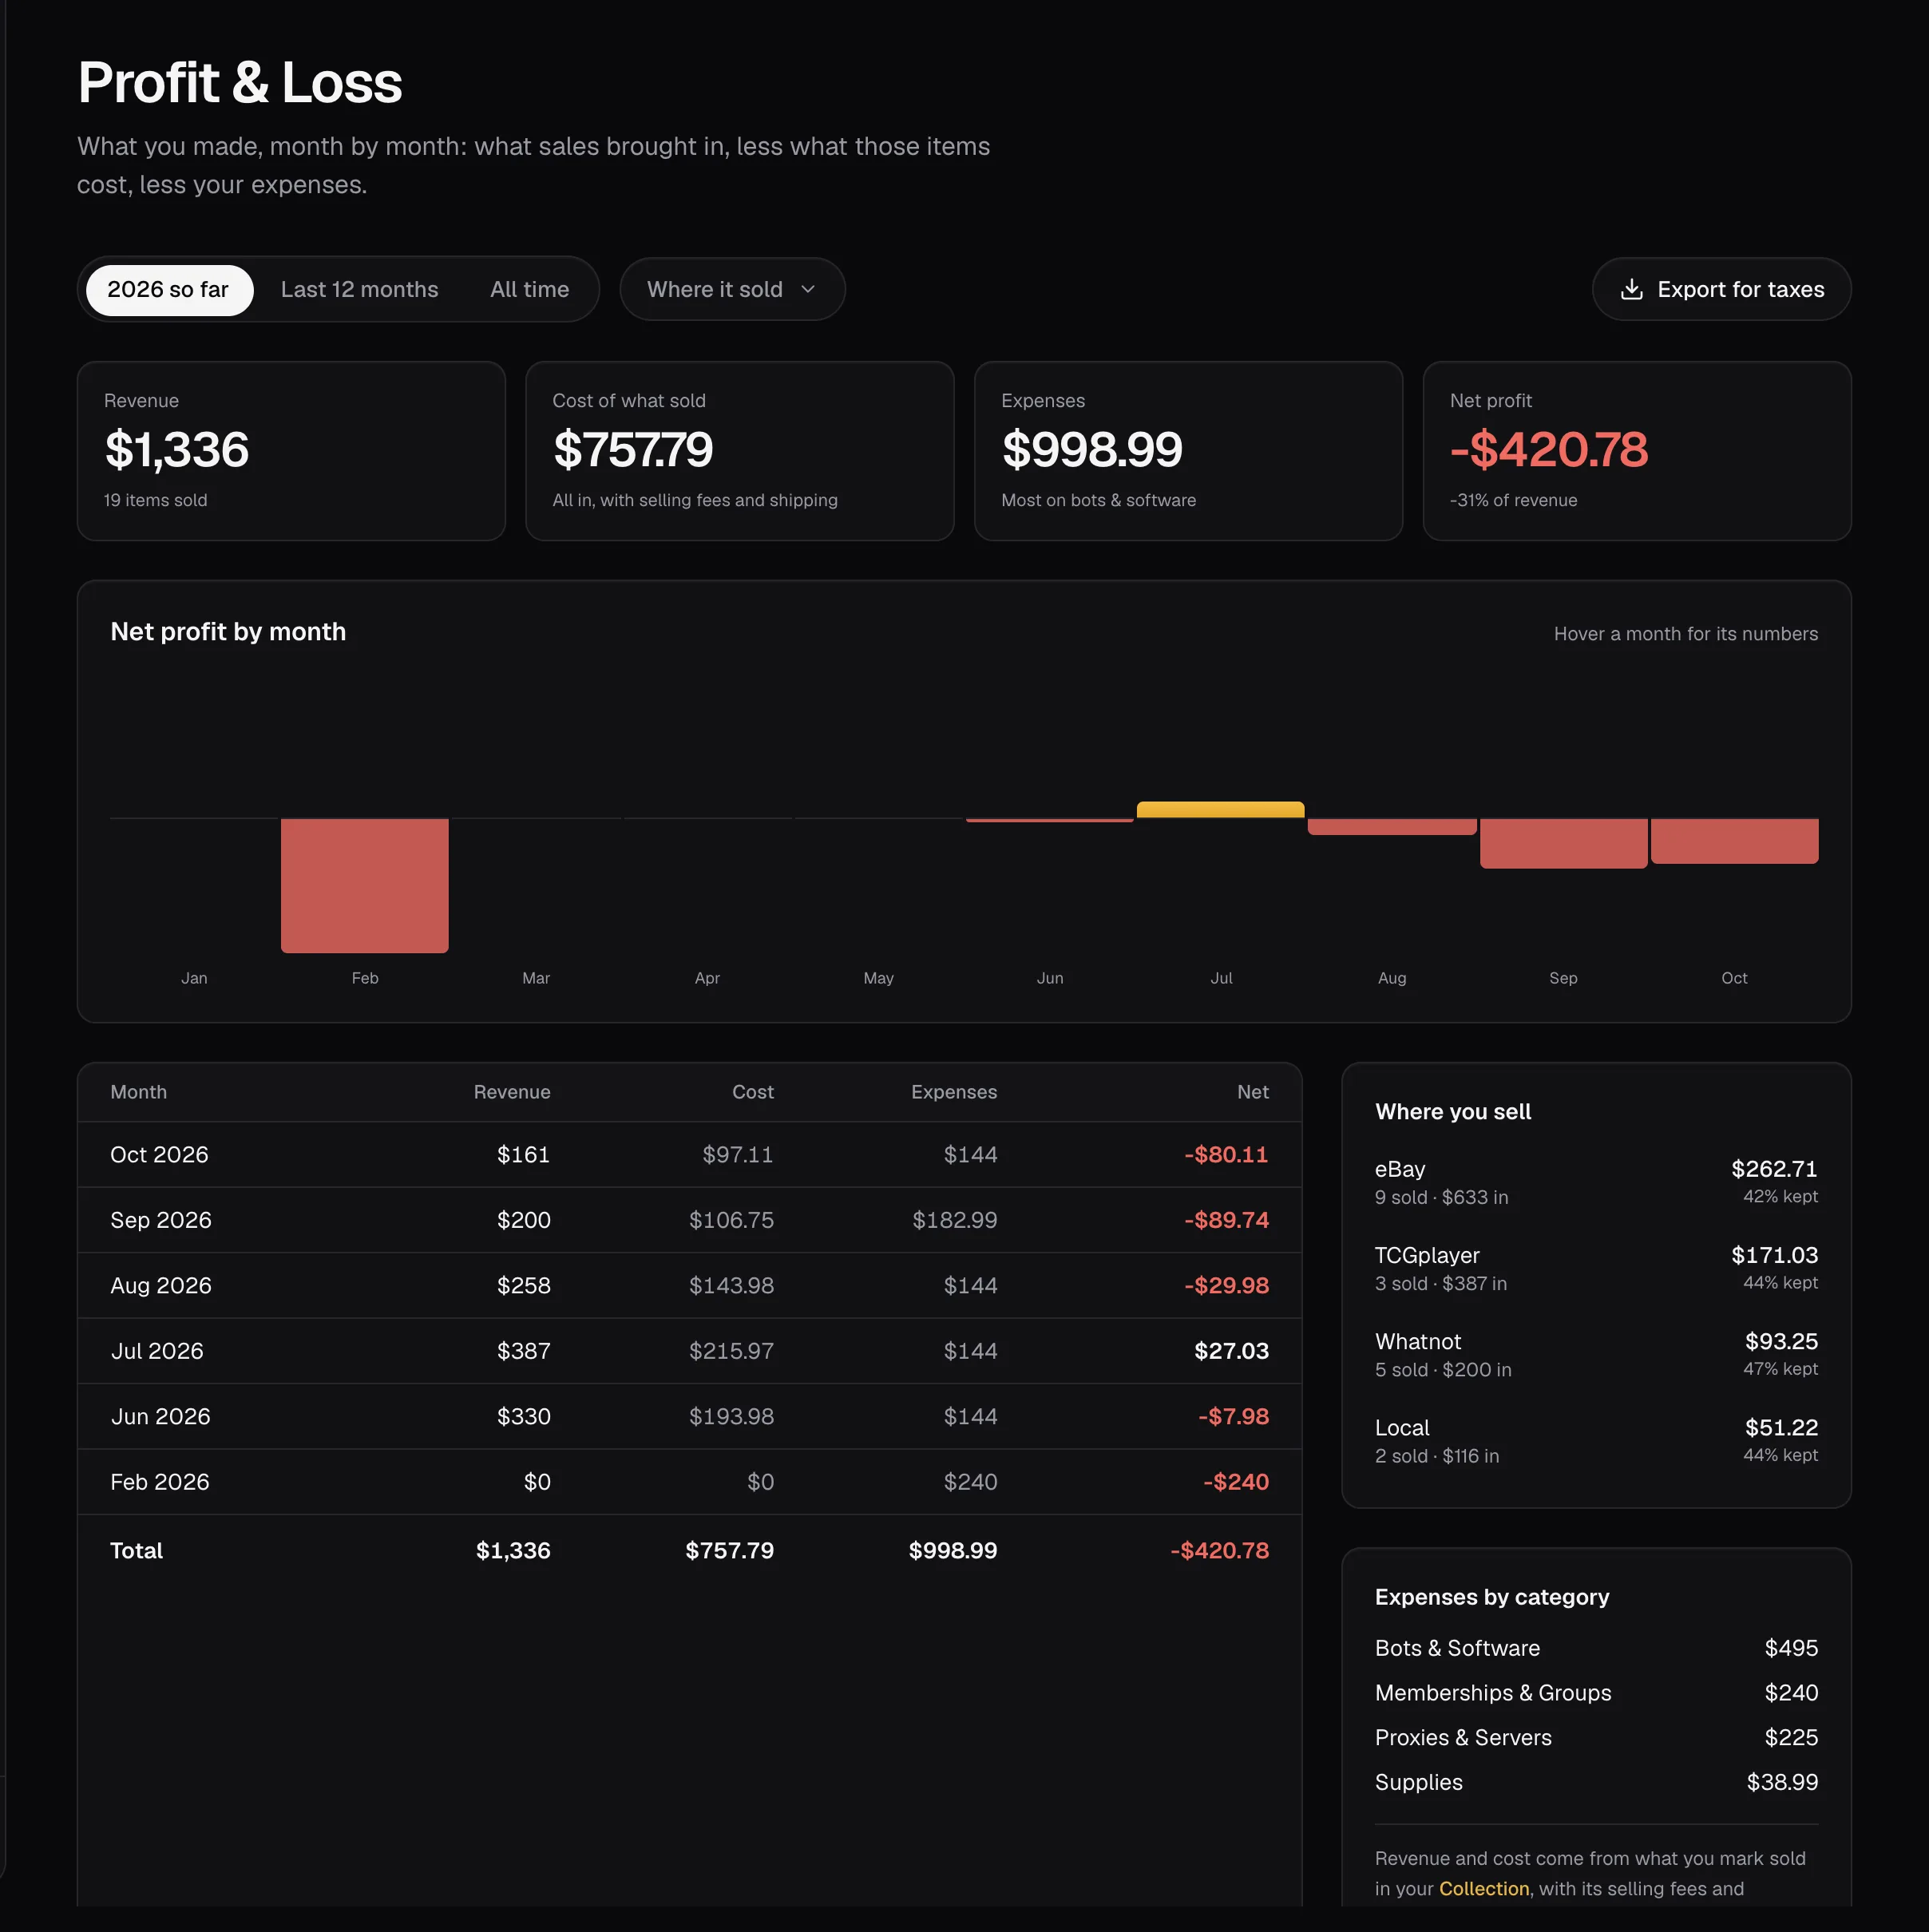
Pick this year, the last 12 months or all time. Export for taxes downloads every month with each expense category split out. What you still hold isn't counted until it sells, so record sales as they happen.
Expenses
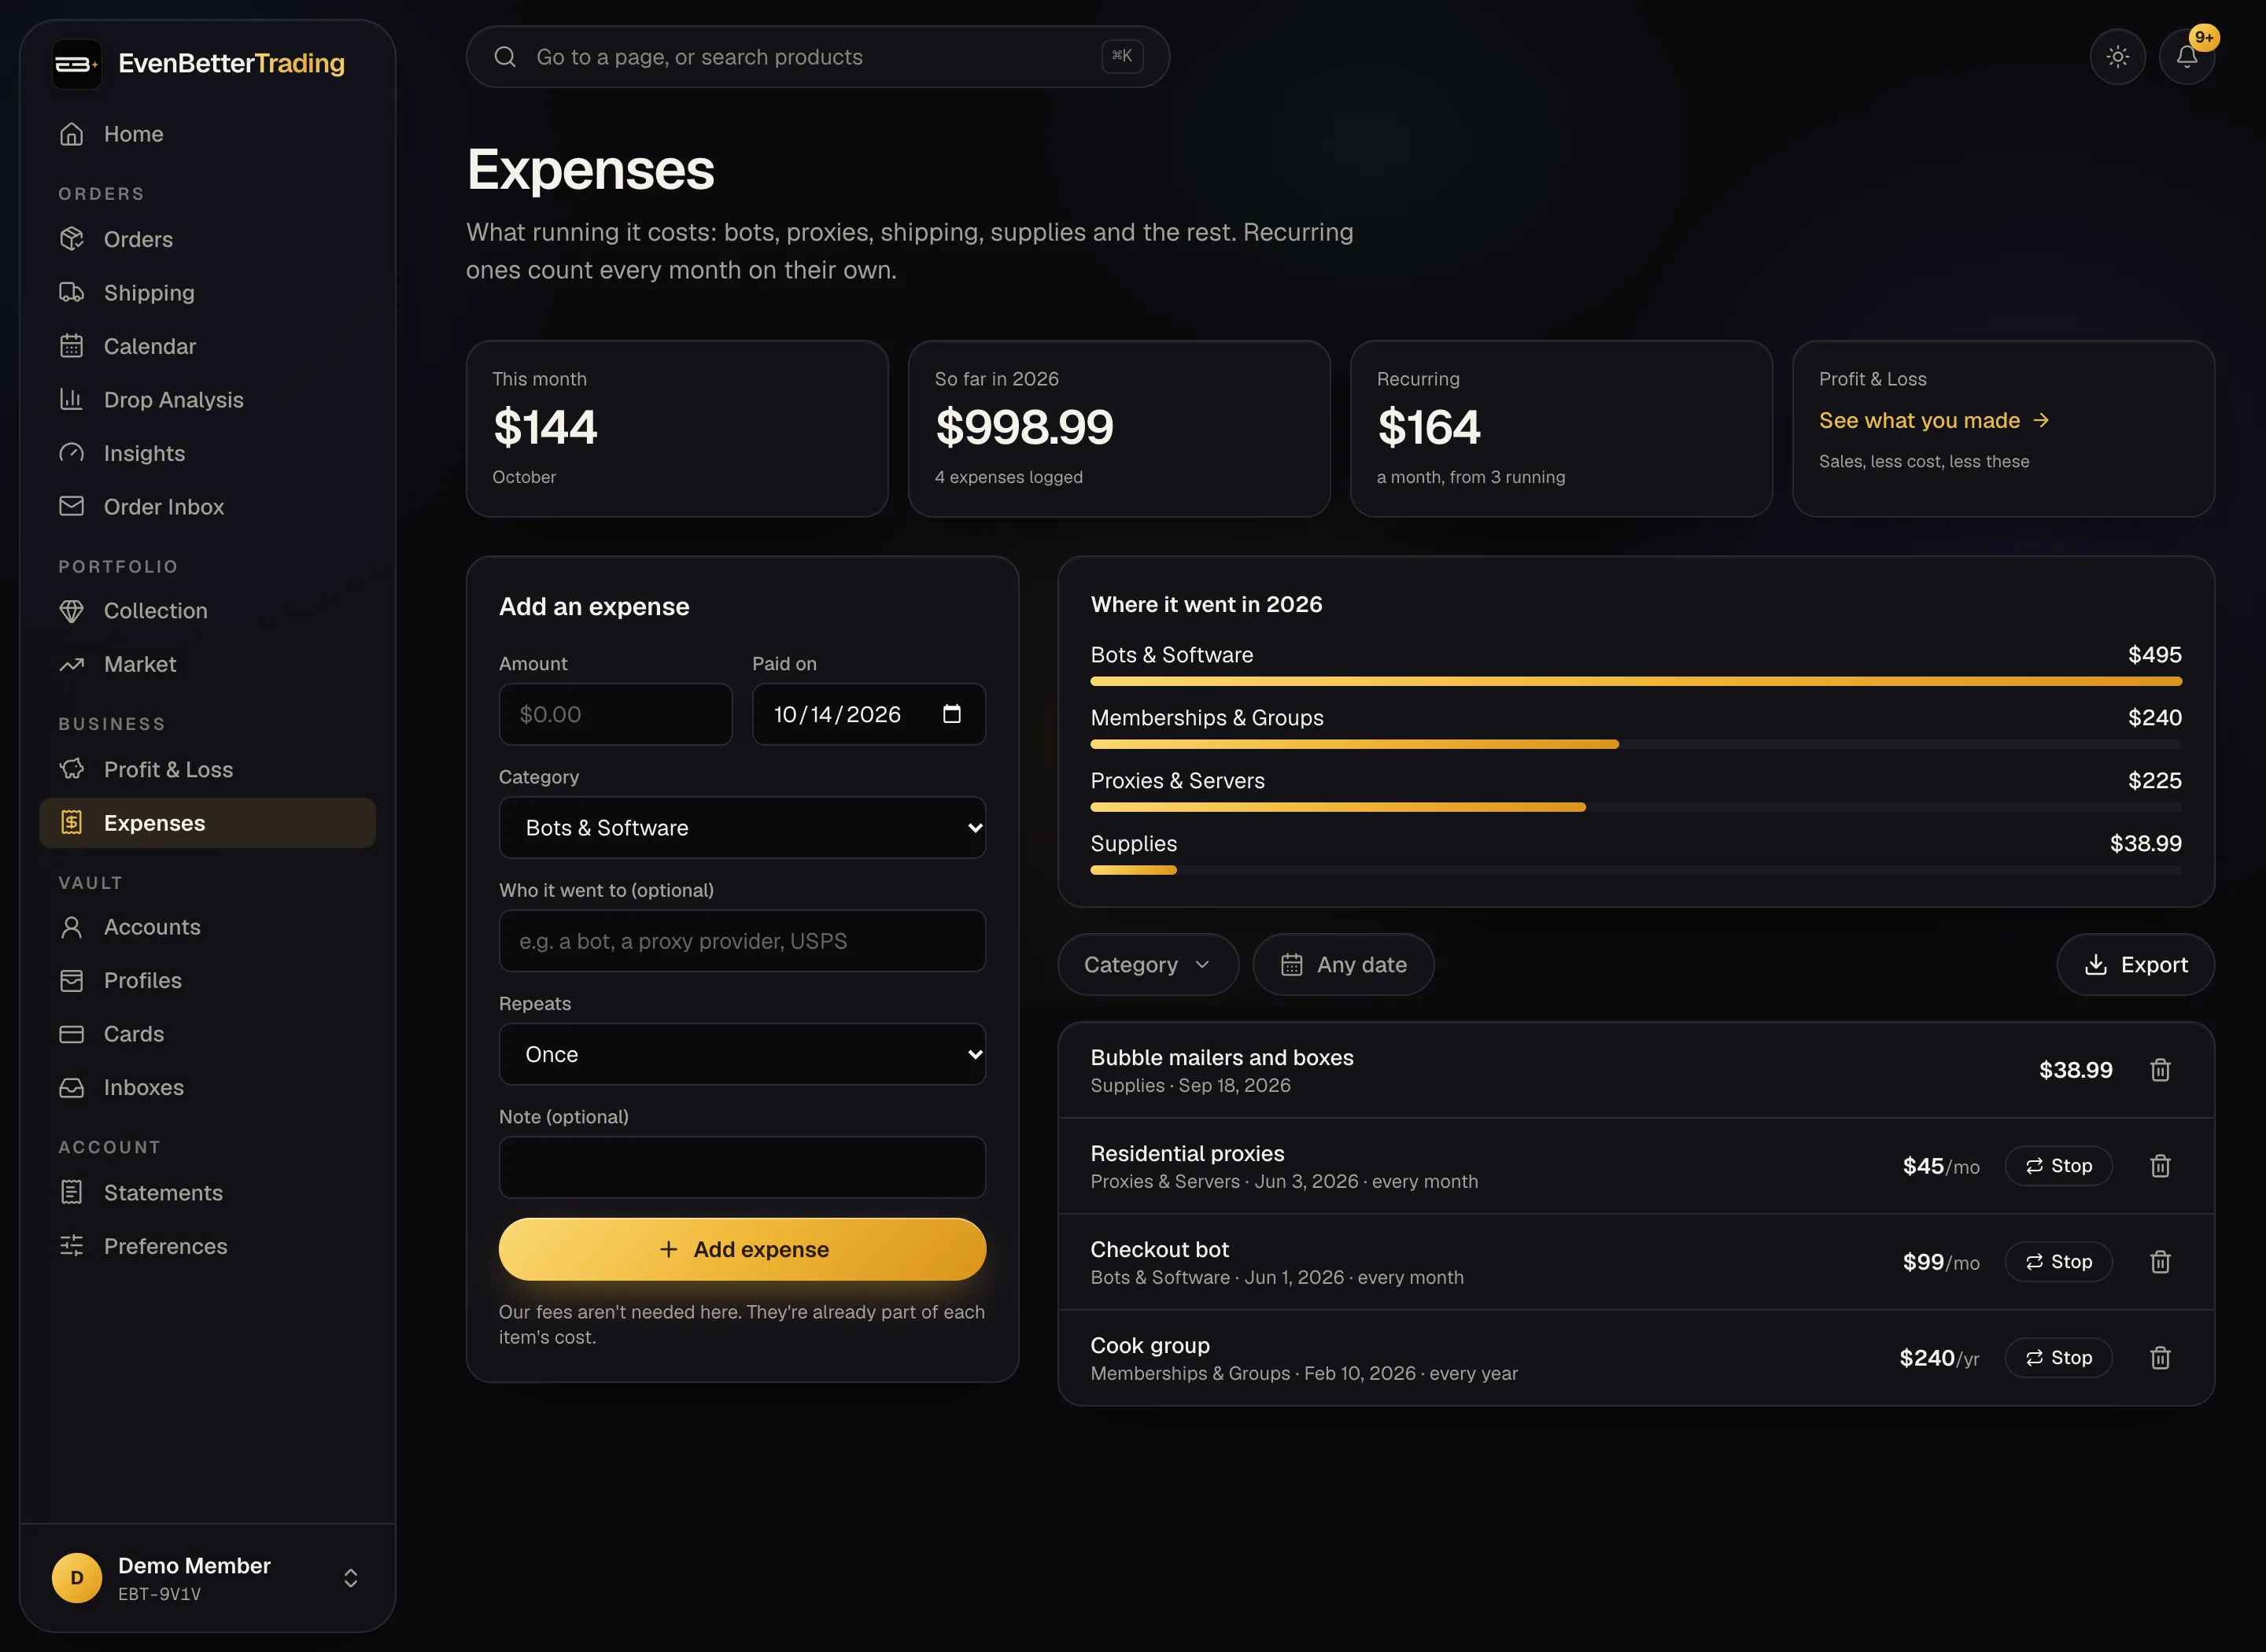
Add what you spend on Expenses: bots, proxies, groups, shipping, supplies, grading, shows. Set a subscription to repeat monthly or yearly and it counts on its own; press Stop when you cancel it.
Drop analysis and insights
In the desktop app:
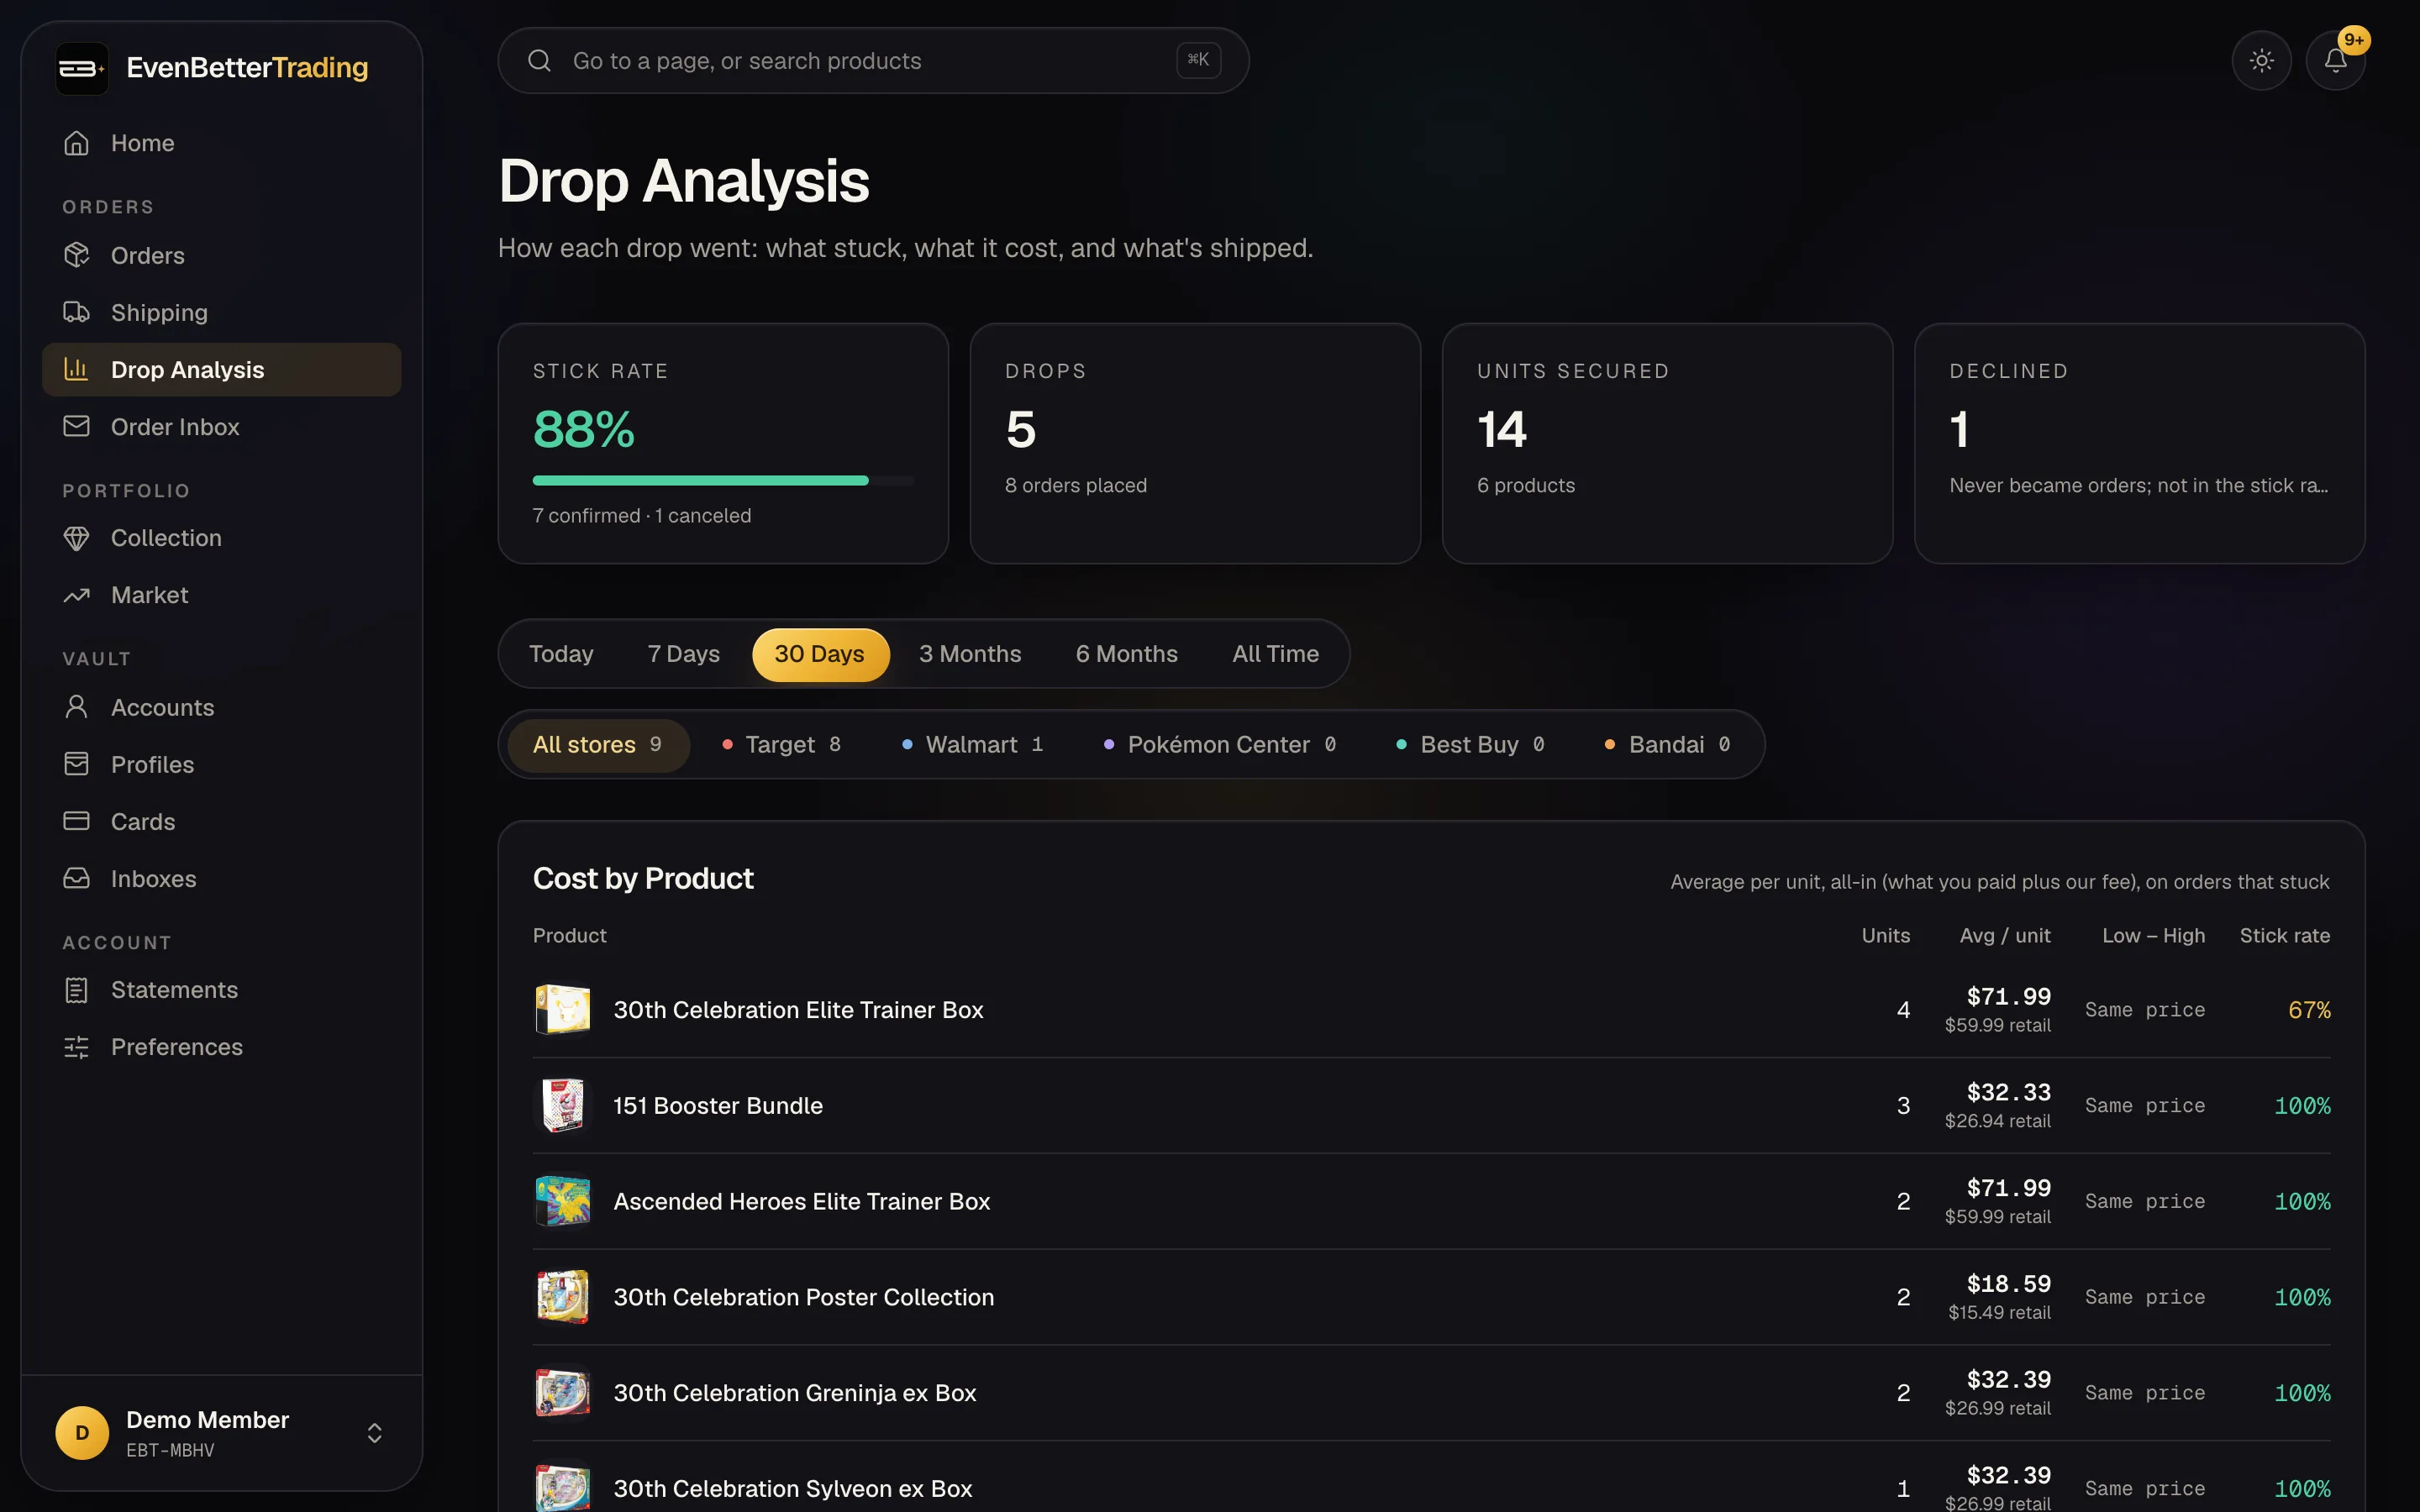
- Drop Analysis groups your orders by drop, one store on one day, so you see how each release went: units, what stuck, and the cost per unit.
- Insights shows how each account, card and profile is doing: how often orders stick, get held for review, ship or get canceled. Anything doing badly is marked, so you can rest it or swap it out.
On Collector, these pages show what Pro includes. Your sales and expenses are kept either way, so nothing is lost if you upgrade later.